
Imagine you’re at a café, eagerly waiting for a freshly brewed coffee to kickstart your day. As minutes tick by without your order, your anticipation turns to annoyance. Nearby, another café bustles with quick service and satisfied customers. This situation parallels the online world, where a slow-loading website tests user patience, often pushing them towards faster alternatives. In today’s incredibly competitive internet landscape, speed is essential to keeping visitors engaged and coming back. Google recognised this critical issue, which is why they developed PageSpeed Insights – a free tool that provides advice on optimising website speed.
Improving site speed might seem complicated, but PageSpeed Insights breaks it down into actionable steps. As we explore using this tool you’ll learn why performance matters so much, how speed impacts conversions and revenue, and specific ways you can accelerate your site. With strategic speed optimisations, your digital presence will engage more visitors and edge out the competition.
Just like that bustling café across the street, your website can be the one customers choose to stick with!
Why is It Important to Have a Fast Website?
Impact of Page Speed on SEO
Search engines like Google have long considered page speed a critical factor in their ranking algorithms. A fast-loading website provides a better user experience and is rewarded with higher search engine results page (SERP) rankings. This visibility can be the difference between a customer discovering your website or your competitor’s.
Impact of Website Speed on Conversion Rates
The speed of your website also directly impacts your bottom line. Even a one-second delay in page load time can significantly reduce page views, customer satisfaction, and conversion rates. A recent study by Portent found that a B2B site that loads in 1 second has a conversion rate 3x higher than a site that loads in 5 seconds, and a B2C eCommerce site that loads in 1 second has a conversion rate 2.5x higher than a site that loads in 5 seconds. In an age where consumers expect instantaneous results, ensuring your website loads as fast as possible is crucial for maintaining a competitive advantage and maximising revenue.
How to Check Your Website Speed?
Tools to Perform a Website Speed Test
There are numerous tools available to test the speed of your website. Each offers unique insights into how your site performs under different conditions and provides actionable feedback for improvement. GTMetrix, Pingdom and WebPageTest are popular solutions with free and paid options. Google offers free tools like PageSpeed Insights and Lighthouse. PageSpeed Insights can only test publicly accessible web pages via a simple URL input. Lighthouse, on the other hand, provides additional flexibility and the ability to assess performance in a local development environment.
For this article, we’ve focused on how to use Google’s PageSpeed Insights testing tool, as it combines data from real-world user experiences with data from a controlled testing environment to give a comprehensive view of your website’s performance.
What is Google PageSpeed Insights?
Among the plethora of tools, Google PageSpeed Insights stands out for its comprehensive analysis and integration with Google’s own best practices for web performance. It’s a free tool that evaluates the speed of your website on both mobile and desktop devices, offering a user-friendly report that pinpoints areas for enhancement relating to your performance, accessibility, best practices and SEO.
Understanding PageSpeed Insights Metrics
PageSpeed Insights analyses the content of a web page and then generates recommendations to make that page faster. The analysis is twofold, providing both field data, reflecting real-world loading experiences, and lab data, which simulates a page load in a consistent, controlled environment.
Core Web Vitals Based on Real-world Field Data
Core Web Vitals are critical metrics for understanding and enhancing user experience on web pages, focusing on loading times, interactivity, and visual stability. These vitals are part of the Web Vitals initiative and are measured using real-world usage data provided by the Chrome User Experience Report (CrUX). CrUX compiles user interaction data from millions of Google Chrome users who have opted to share their browsing history, offering insights into the performance of websites across various conditions and devices. We tested the Think with Google website in the example below:
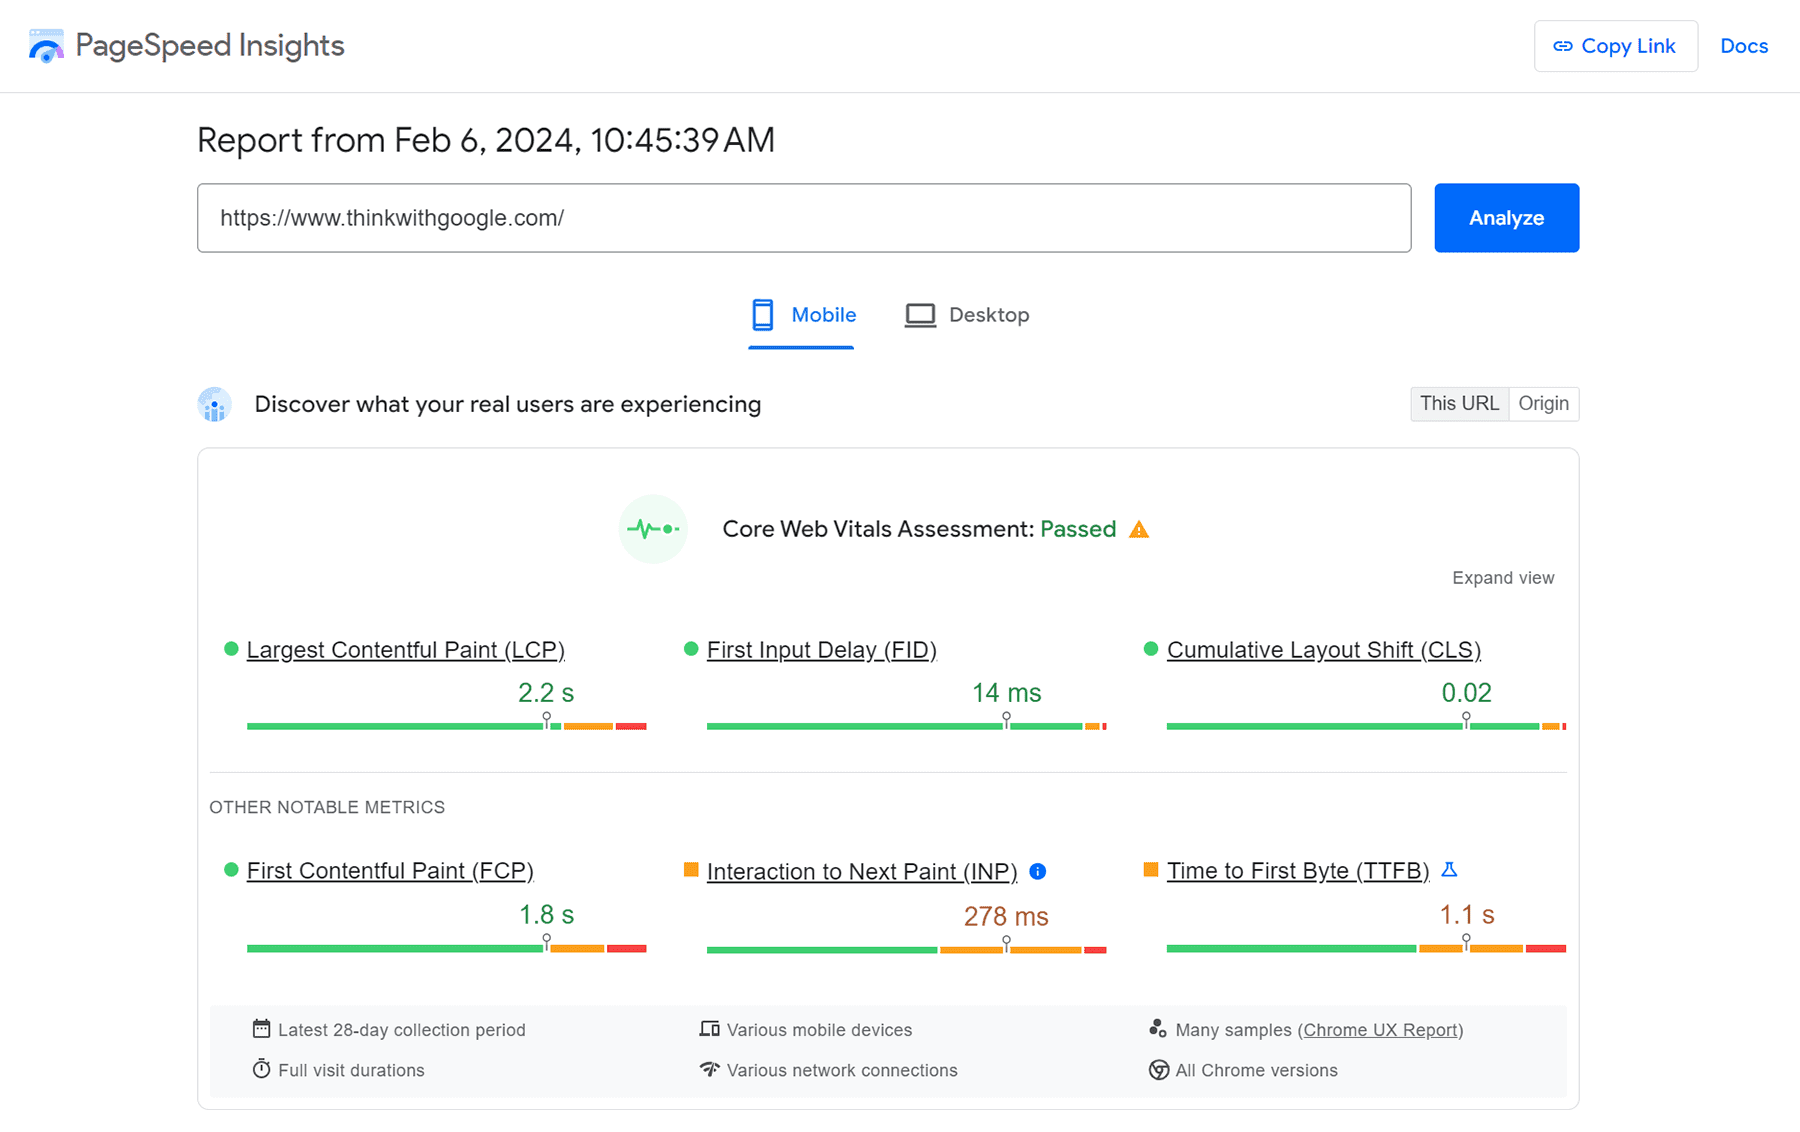
This real-world data ensures that the Core Web Vitals accurately reflect user experiences, guiding developers and site owners to prioritise optimisations that improve the web for everyone. The metrics that make up the Core Web Vitals are:
-
Largest Contentful Paint (LCP): Measures perceived load speed. Ideal LCP is within 2.5 seconds of when the page starts loading.
-
First Input Delay (FID): Measures the time from when a user first interacts with your site to the time when the browser is able to respond to that interaction. A good benchmark is 100 milliseconds or less.
-
Cumulative Layout Shift (CLS): Measures visual stability as it quantifies how often users experience unexpected layout shifts. Pages should strive for a CLS of 0.1 or less.
-
First Contentful Paint (FCP): Measures the time from when the page starts loading to when any part of the page’s content is rendered on the screen. Aiming for an FCP of 1.8 seconds or less is considered good.
-
Interaction to Next Paint (INP): Reflects the responsiveness of a page by measuring the delay between user interactions and the visual response or next paint. For a good user experience, you should aim for an INP of 200 milliseconds or less.
-
Time to First Byte (TTFB): Measures the time it takes for a user’s browser to receive the first byte of page content from the server. The ideal score is 800 milliseconds or less. A lower TTFB indicates a quicker server response to requests, which is crucial for fast loading times.
Performance Diagnostics Based on Simulated Lab Data
Lab diagnostic data within the PageSpeed Insights report is generated through the Lighthouse API, offering a predictive analysis of a webpage’s performance in a controlled testing environment. Unlike field data, which reflects actual user experiences, lab data provides developers with an immediate, isolated assessment of their site’s performance and potential issues. This simulated environment allows for consistent testing conditions, ensuring that performance metrics are not influenced by variable network conditions or different devices. The available Lighthouse metrics are illustrated below:
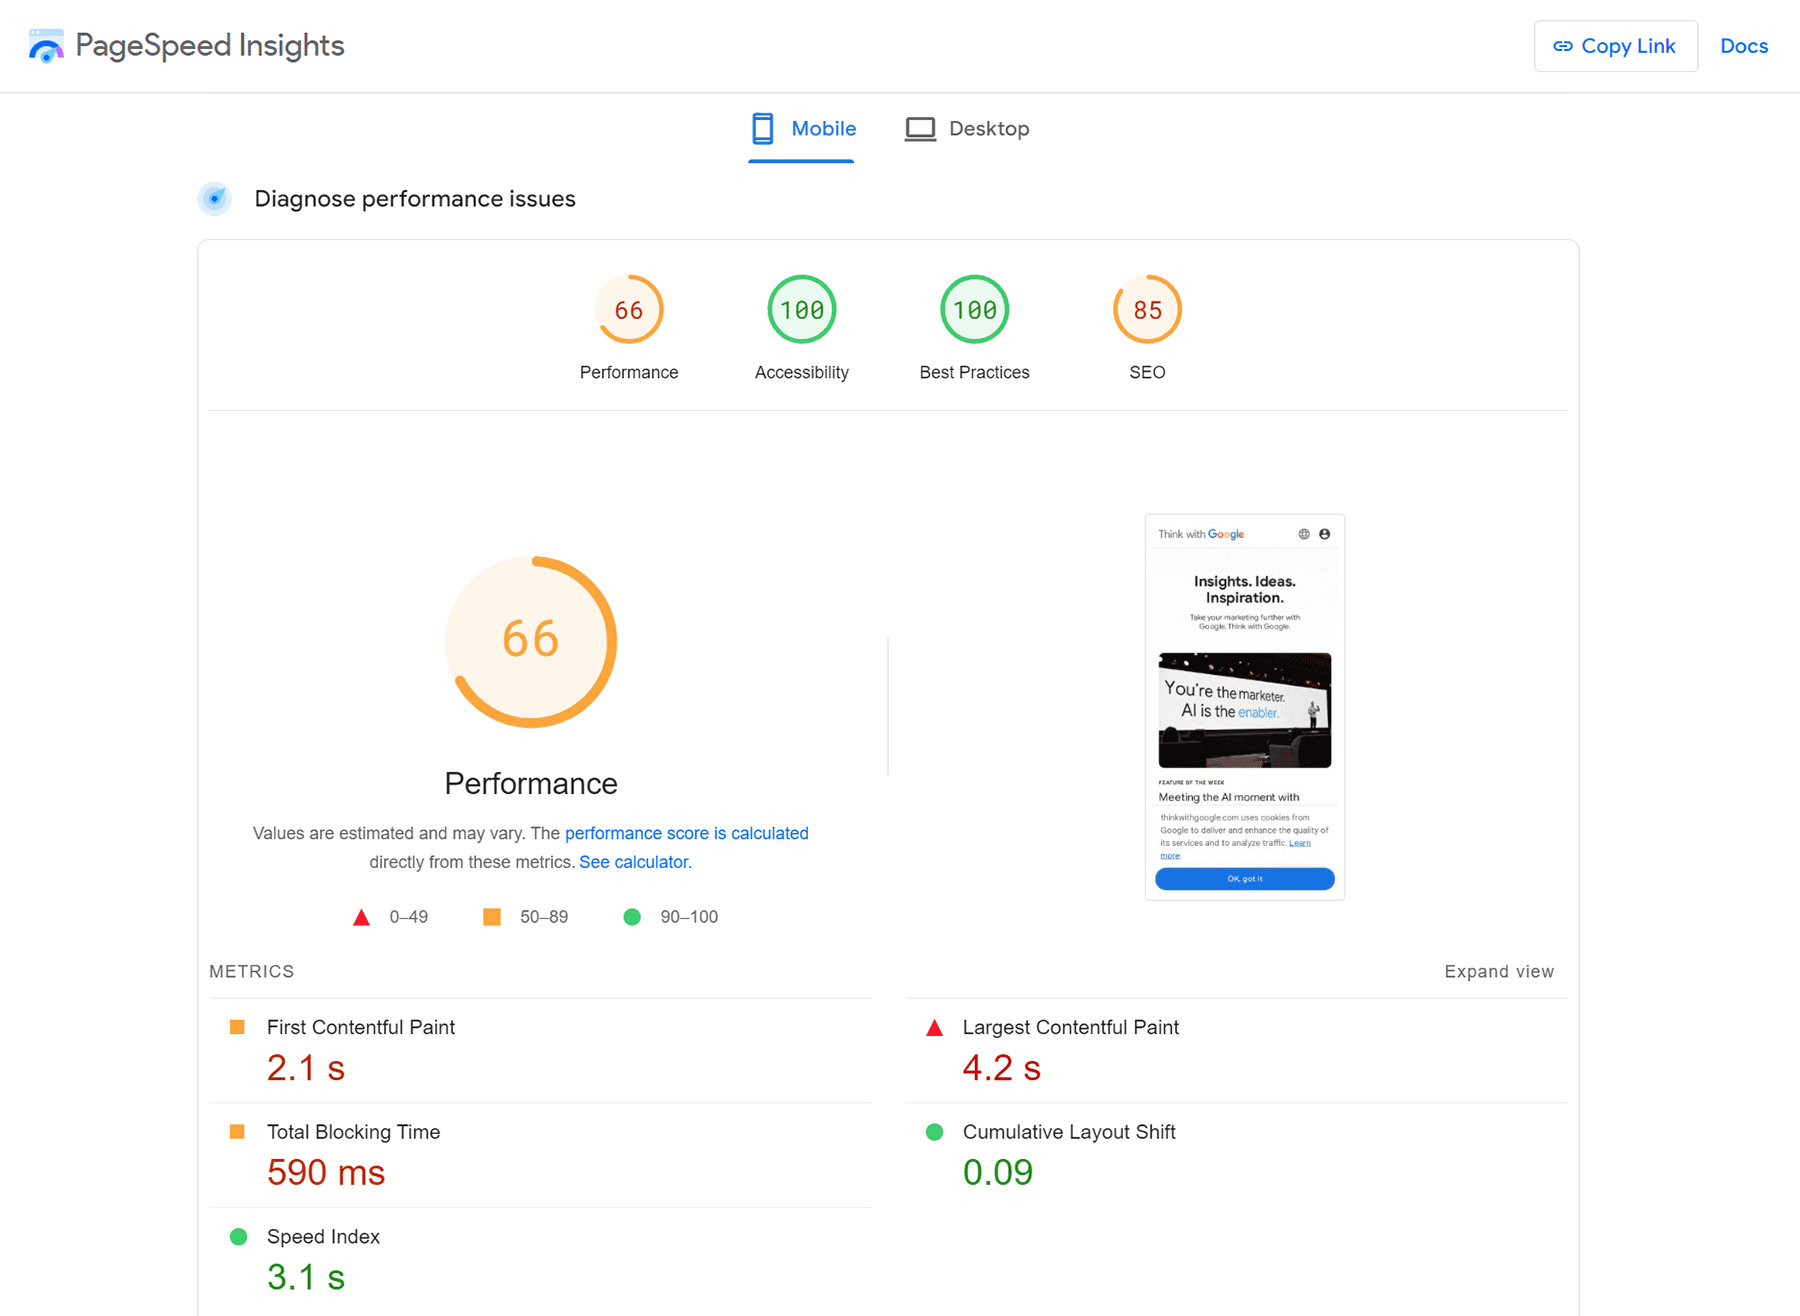
By leveraging this lab data, developers and site owners can proactively address performance bottlenecks, enhance user experience, and fine-tune their websites before these potential issues affect real-world users. Key metrics include:
-
First Contentful Paint (FCP): The time from when the page starts loading to when any part of the page’s content is rendered on the screen. Aim for 1.8 seconds or faster.
-
Largest Contentful Paint (LCP): Measures when the main content of the page is likely to have loaded in a simulated environment. Aim for 2.5 seconds or faster, aligning with the real-world goal.
-
Total Blocking Time (TBT): The ideal score is 200 milliseconds or less. This measures the total amount of time after FCP where the main thread is blocked from responding to user input.
-
Cumulative Layout Shift (CLS): The measure of layout shifts occurring during the loading of the page. The ideal score is 0.1 or less, consistent with the real-world target.
-
Speed Index: How quickly the contents of a page are visibly populated. The ideal score is 3.4 seconds or less. This metric is a bit more variable depending on the complexity of the page but aiming for a lower score indicates a better user perception of speed.
Website Speed & Performance Optimisation Steps
Step 1: Run a Speed Test on PageSpeed Insights
Begin by entering your website’s URL into the Google PageSpeed Insights tool. The resulting report will highlight the strengths and weaknesses of your page’s loading performance on both mobile and desktop devices.

Step 2: Review Diagnostics & Opportunities
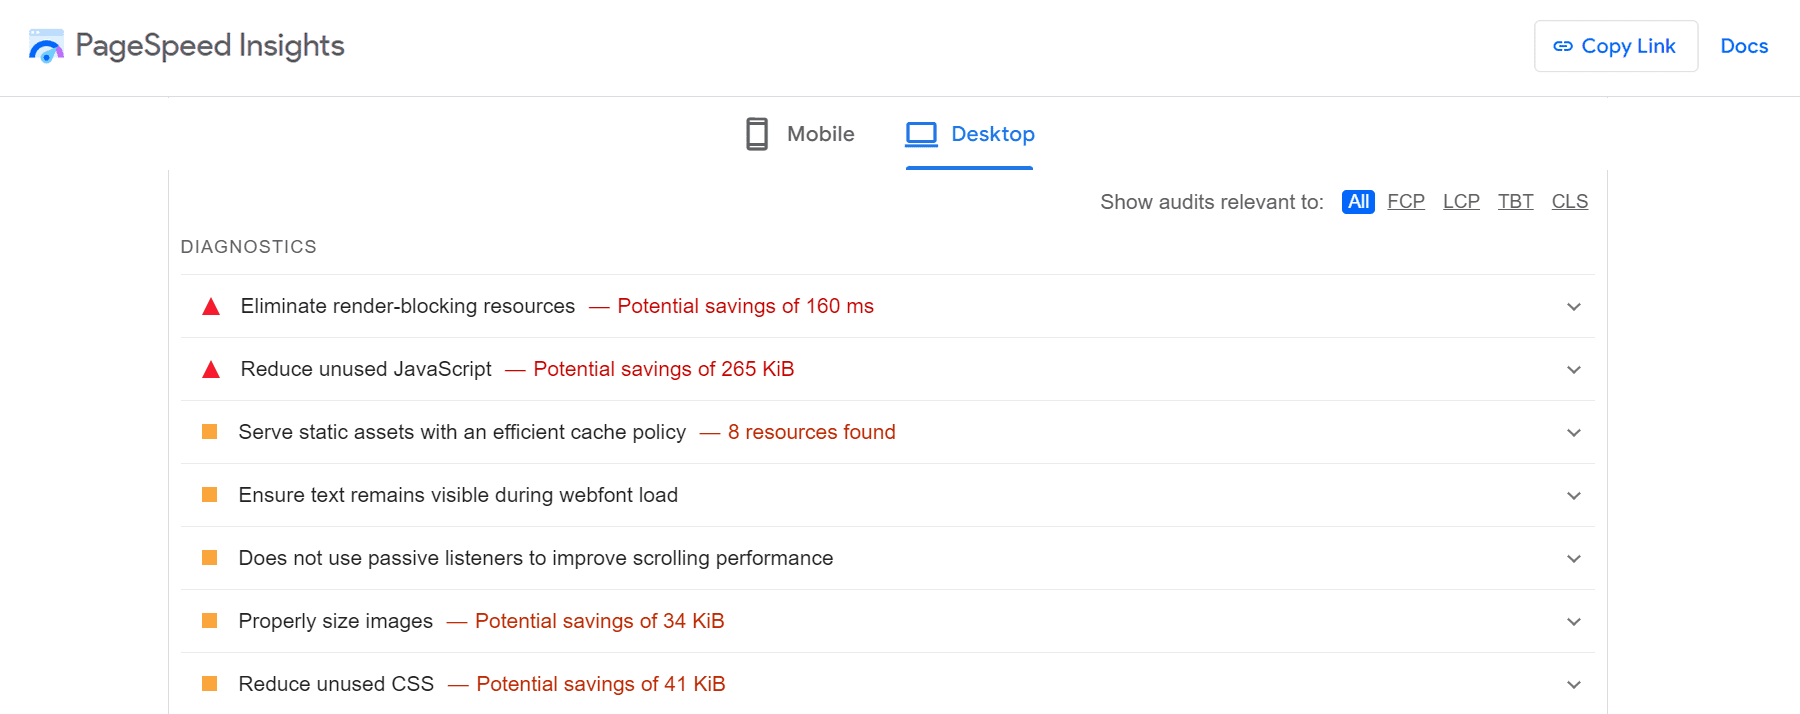
The tool calculates an overall score for performance, accessibility, best practices and SEO, and provides a detailed list of diagnostics and optimisation opportunities that suggest how you can improve your website speed. These diagnostics are prioritised from highest to lowest impact on your site’s performance.
Step 3: Implement Optimisation Recommendations
Start with the opportunities that will make the most significant impact on your website’s speed. Thankfully, PageSpeed Insights groups and colour-codes the optimisation opportunities to indicate which ones require your attention first. Red items are performing poorly and should be resolved first, yellow ones need improvement, and green ones are good.
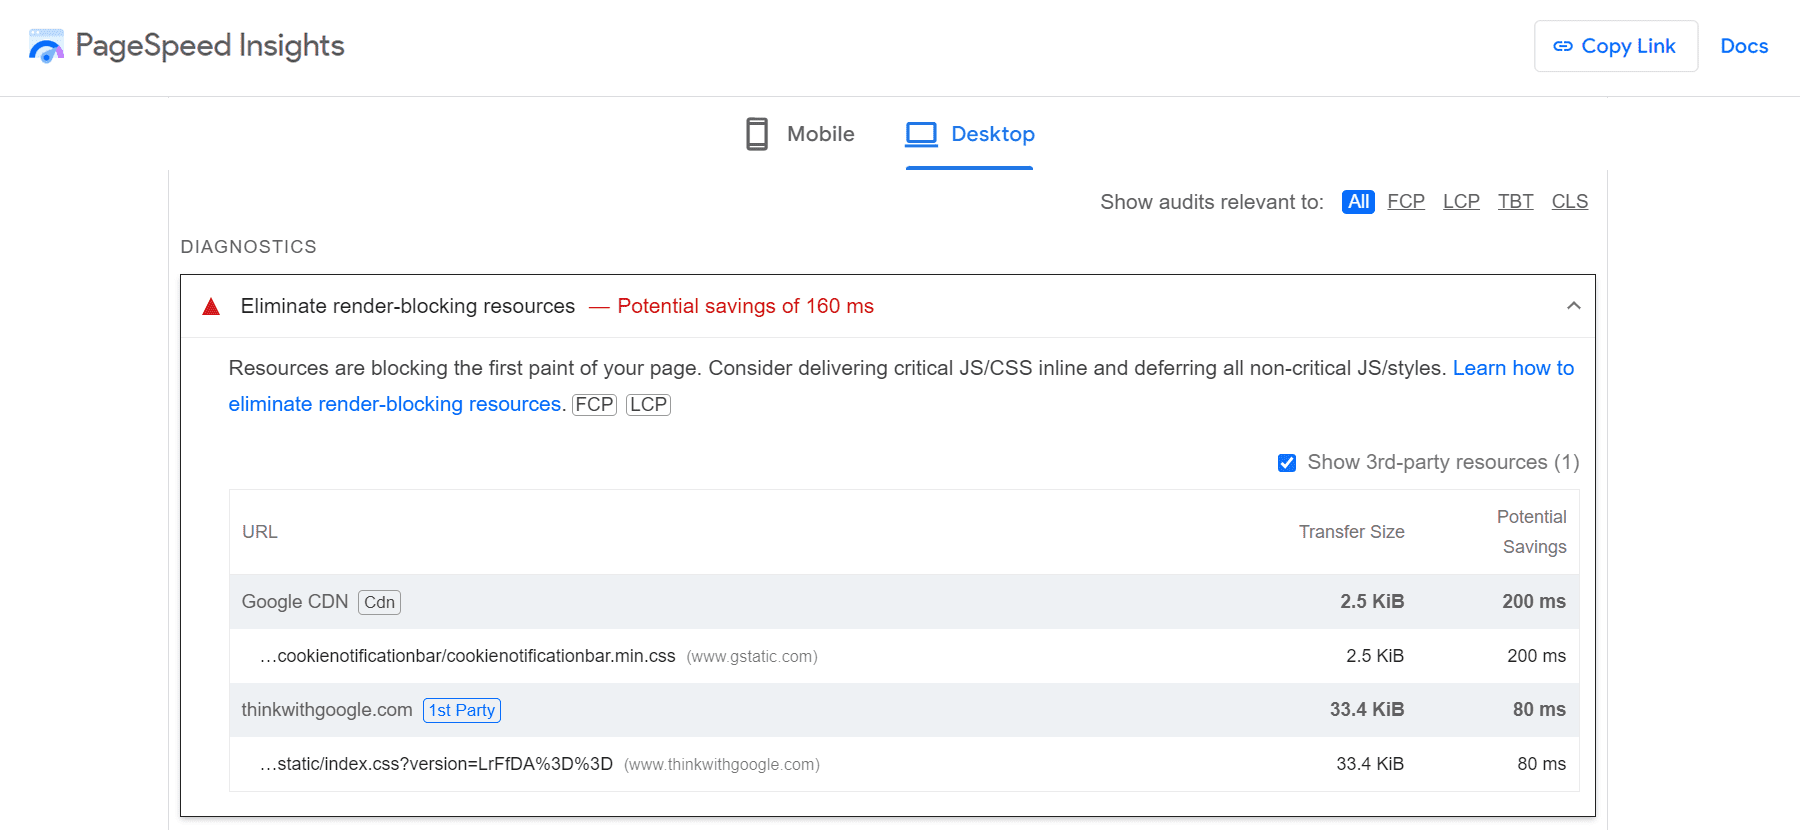
The type of recommendations you may need to implement include optimising images, leveraging browser caching, or minifying CSS, JavaScript, and HTML, to name a few. When you click on each row, you’ll see a clear breakdown of the reason for the suggested optimisation, along with links to additional information to give you more background and instructions on how to implement the change. You’ll also see a list of the affected resources, with an indication of the potential savings, so you’ll know exactly what the impact will be on the overall transfer size or load speed of your page.
After implementing each fix, retest to confirm that the optimisation was implemented successfully. You’ll start seeing your performance scores and speed metrics improve incrementally. Continue applying all the recommended optimisations listed in the mobile and desktop diagnostics. Many website owners obsess over achieving a perfect performance score, but keep in mind that the real objective is to speed up your website, so as long as you can see your performance metrics improve, you’re on the right track.
Although PageSpeed Insights does an excellent job of outlining these issues and guiding you to the perfect solutions, the recommendations can be quite technical. If you need help implementing the changes, you can reach out to a developer or web development agency like Cybersolve to assist you with your website optimisation.
Step 4: Regularly Test Website Performance
Web performance is not a one-time fix but a continual process of improvement. Regular testing helps you identify how updates to your site or content affect speed, allowing for timely optimisations. There are paid tools like GTMetrix and Pingdom that provide automated performance monitoring of your website, but if you prefer using a tool that’s completely free and in line with Google’s own best practices, then PageSpeed Insights is a great solution. Testing your website using multiple tools can give you a comprehensive understanding of your website’s performance, so feel free to expand your horizons.
Final Words
A fast-loading website is not just a nice-to-have; it’s a critical component of your online presence that impacts everything from SEO to conversion rates. Tools like Google PageSpeed Insights provide valuable insights into your website’s performance, offering clear, actionable steps to enhance speed and, by extension, your user experience. By regularly monitoring and optimising your site, you ensure it remains fast, efficient, and ahead of the competition. Have you checked your website’s speed lately?
